
Learn · Chapter 8 · one match, about an hour
Reading the Real Game
Traditional stats treat all shots as identical. That's like judging restaurants by how many plates they serve rather than whether the food's any good. Expected goals measures quality instead of just counting.
The exercise
Analyse one match through the xG lens in three stages.
- The traditional stats. Final score, shot counts, possession, pass completion and corners.
- The xG picture. Total xG for both teams, individual shot values, and the key moments that generated high-quality chances.
- Compare the two. Who created better chances relative to their possession? How did shot quality compare to shot count? What patterns led to the highest-xG opportunities?
Afterwards, be honest: where did the traditional stats give you a misleading picture? What did xG reveal that the raw numbers missed? And how does quality over quantity change your read of the match?
Worked example: Brighton 1-1 Leeds
Premier League 2026/27, 5 September 2026.
Stage 1: the traditional stats
| Brighton | Leeds | |
|---|---|---|
| Score | 1 | 1 |
| Possession | 66% | 34% |
| Shots | 20 | 10 |
| Corners | 7 | 6 |
Read only this and Brighton dominated: twice the ball, twice the shots, and unlucky to draw.
Stage 2: the xG picture
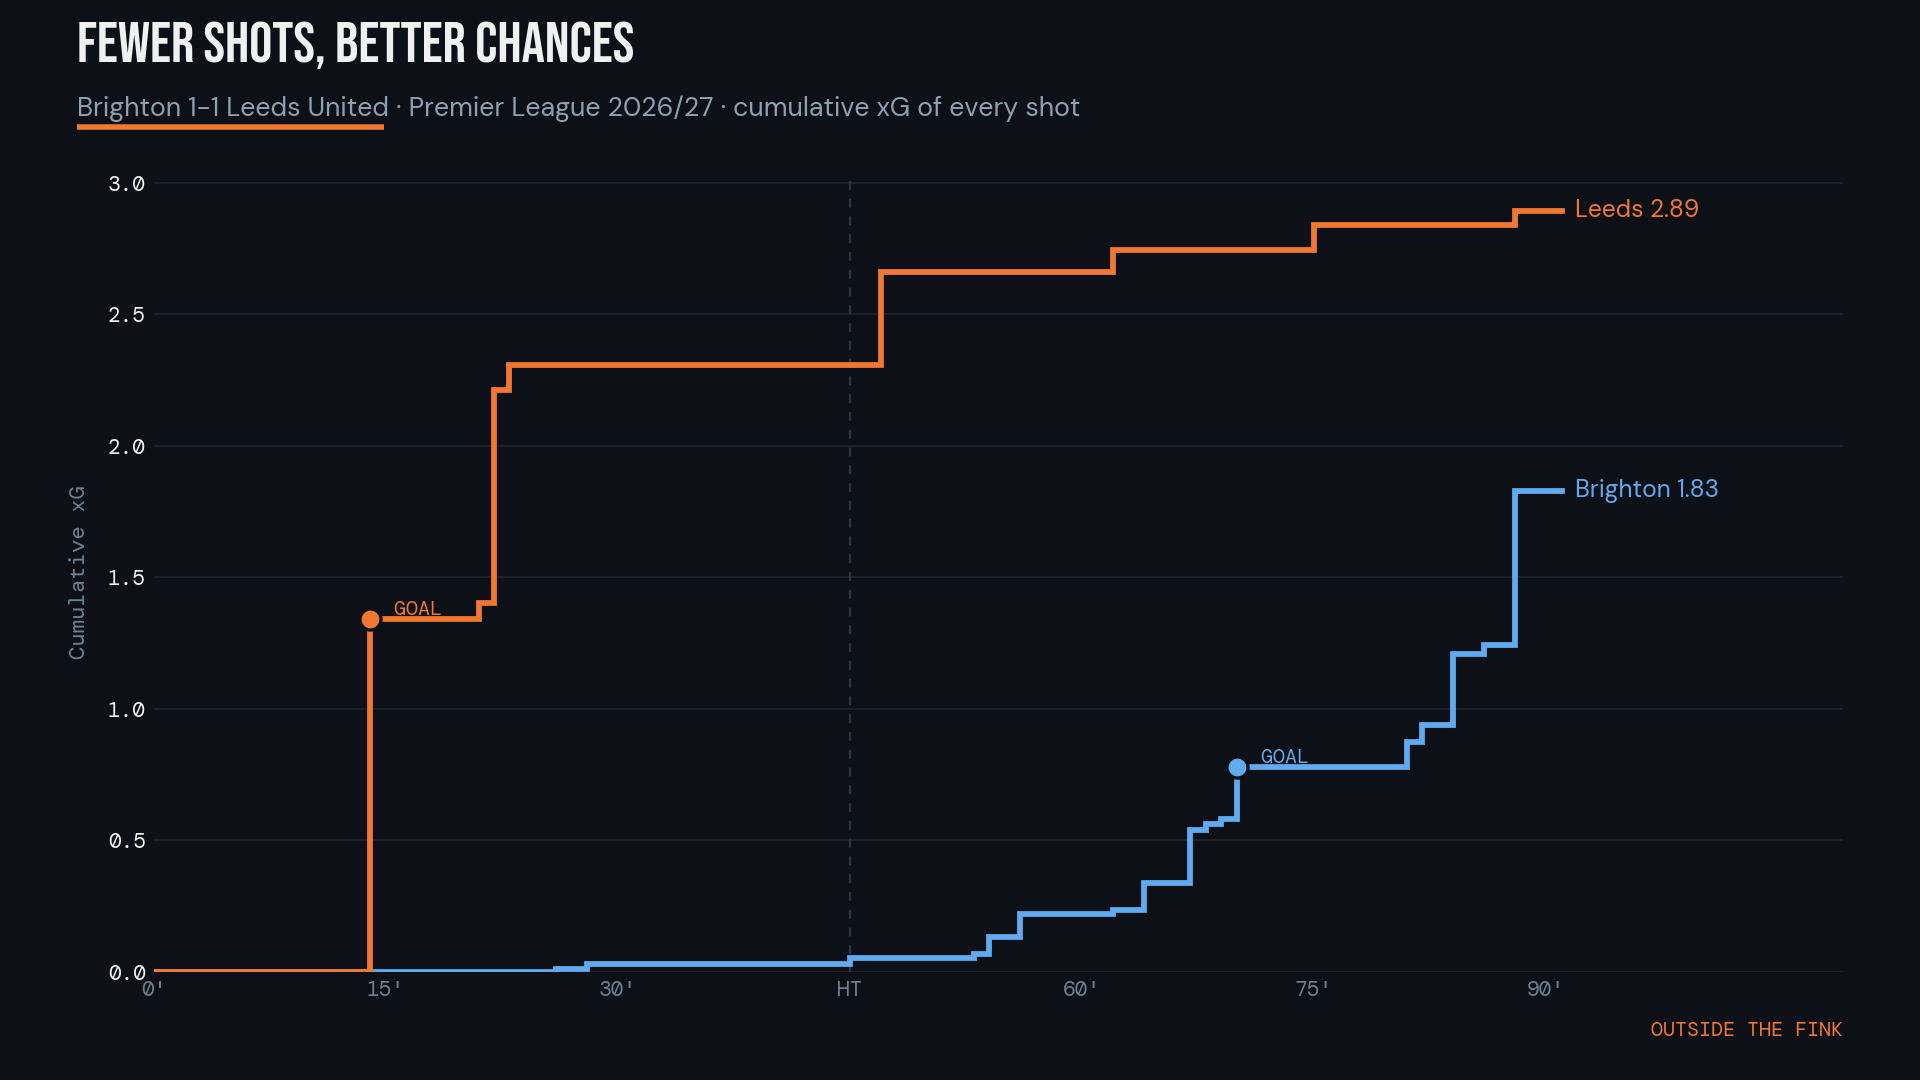
Leeds' ten shots averaged about 0.29 xG each. Brighton's twenty averaged about 0.09. Leeds' best chances came early: three shots in one move in the 14th minute ending in Bogle's goal (0.66), then a 0.81 chance for Calvert-Lewin that was blocked. Brighton's biggest chance was a 0.46 for Groß in the 88th minute, off target.
Stage 3: compare the two
- Relative to possession: Leeds created more with a third of the ball.
- Quality v count: Brighton took twice the shots, mostly from low-value positions. Five of their twenty were blocked.
- The honest caveat: xG adds up every shot in a move, but one move can only produce one goal. Leeds' 14th-minute move counts three times in that 2.89. The direction holds; the exact gap is smaller than it looks.
Possession without purpose is just keeping the ball for a laugh.
Done well when
- You wrote down your read after stage 1, before looking at xG.
- You can name the two or three moments that made most of each team's xG.
- You can say in one sentence where the traditional stats misled you.
- You named at least one limit of xG, like the repeated-shots one above.
Want the rest of the chapter?
This exercise is from So You Want to Be a Football Analyst? Get Chapter 1 free by email, plus one idea from the book each week.